Flexible sensory processing in whole-brain circuits
This is an ongoing research project investigating how the brains of larval zebrafish flexibly process incoming sensory information. I use cross-decomposition methods (Reduced Rank Regression) to investigate how populations of neurons share information to drive behavior.
Introduction
One of the main goals of my postdoc is to study how neural circuits flexibly process sensory information. For example, when we are asleep, how does our brain completely “tune out” sounds that we react and respond to when we are awake? Presumably our ears still work and are providing information about the sound to our brain, yet, somehow, the brain determines that certain sounds are not behaviorally relevant during a sleep state and therefore we do not need to take any action, or, in fact, even consciously perceive them. Thus, the goal of this research is to identify the neural circuit computations that underlie this type of flexible processing ability. In the future, this could help inform the design of better, adaptive sensory prosthetics that dynamically filter incoming sensory information based on the cognitive and behavioral demands of users.
In this post, I provide a bird’s eye view of the approach I have been taking to answer these questions and highlight some of my preliminary findings. Before getting into the data analysis and results, I first provide a general description of the experimental approach and the data. My goal is that with this background information, the results will be interpretable to a general scientific and/or computational audience.
In order to keep this post from getting too long, some details of the analysis and results are omitted. For those comfortable with these topics and interested in digging a bit deeper, please feel free to check out my poster on this topic which I recently presented at FENS 2024 in Vienna.
Outline
Background
During my PhD, I studied how changes in an animal’s internal state (e.g., asleep vs. awake) modulate the way neurons in the brain respond to auditory stimuli. You can read more about an example of this work here. Due to technical limitations of working with “larger” animals, in these experiments I was restricted to measuring the activity of only a handful (10s to 100s) of neurons in a single brain region. One drawback of this approach is that it prevents being able to contextualize the observed patterns of activity within the larger brain network. The brain is a hugely complex interconnected system consisting of multiple brain regions. To fully understand the function of any one region it is important not only measure activity in that region, but also in all the other regions that it communicates with.
Thus, for my postdoc I chose to study the brain of a relatively small animal, the larval zebrafish. Zebrafish have comparatively small brains, yet, possess many molecularly homologous cell types and brain regions to mammals. In addition, they have a well-studied, well-defined behavioral repertoire. Importantly, methods exists to record their whole-brain activity at high spatial resolution during behavior. This type of comprehensive data presents the opportunity to build more sophisticated models that map neural activity across the entire brain to behavior.
Experimental approach
To measure neural activity across the brain, we use an approach called calcium imaging. Briefly, we use genetically modified animals with calcium inidicators encoded into all of their neurons. These indicators report the presence of intracellular calcium concentrations (a readout of neural activity) by changing their fluorescence intensity. We can measure changes in fluorescence over time using a fluorescent microscope.
In our lab, we are interested in the intersection between neural activity and behavior. Most micropscopy techniques, however, require that the specimen being imaged is immobile. This makes the joint study of neural activity and natural behavior difficult, or even impossible. To circumvent this, our lab recently built a state-of-the-art microscope that permits whole-brain imaging, at single cell resolution, in freely behaving fish.
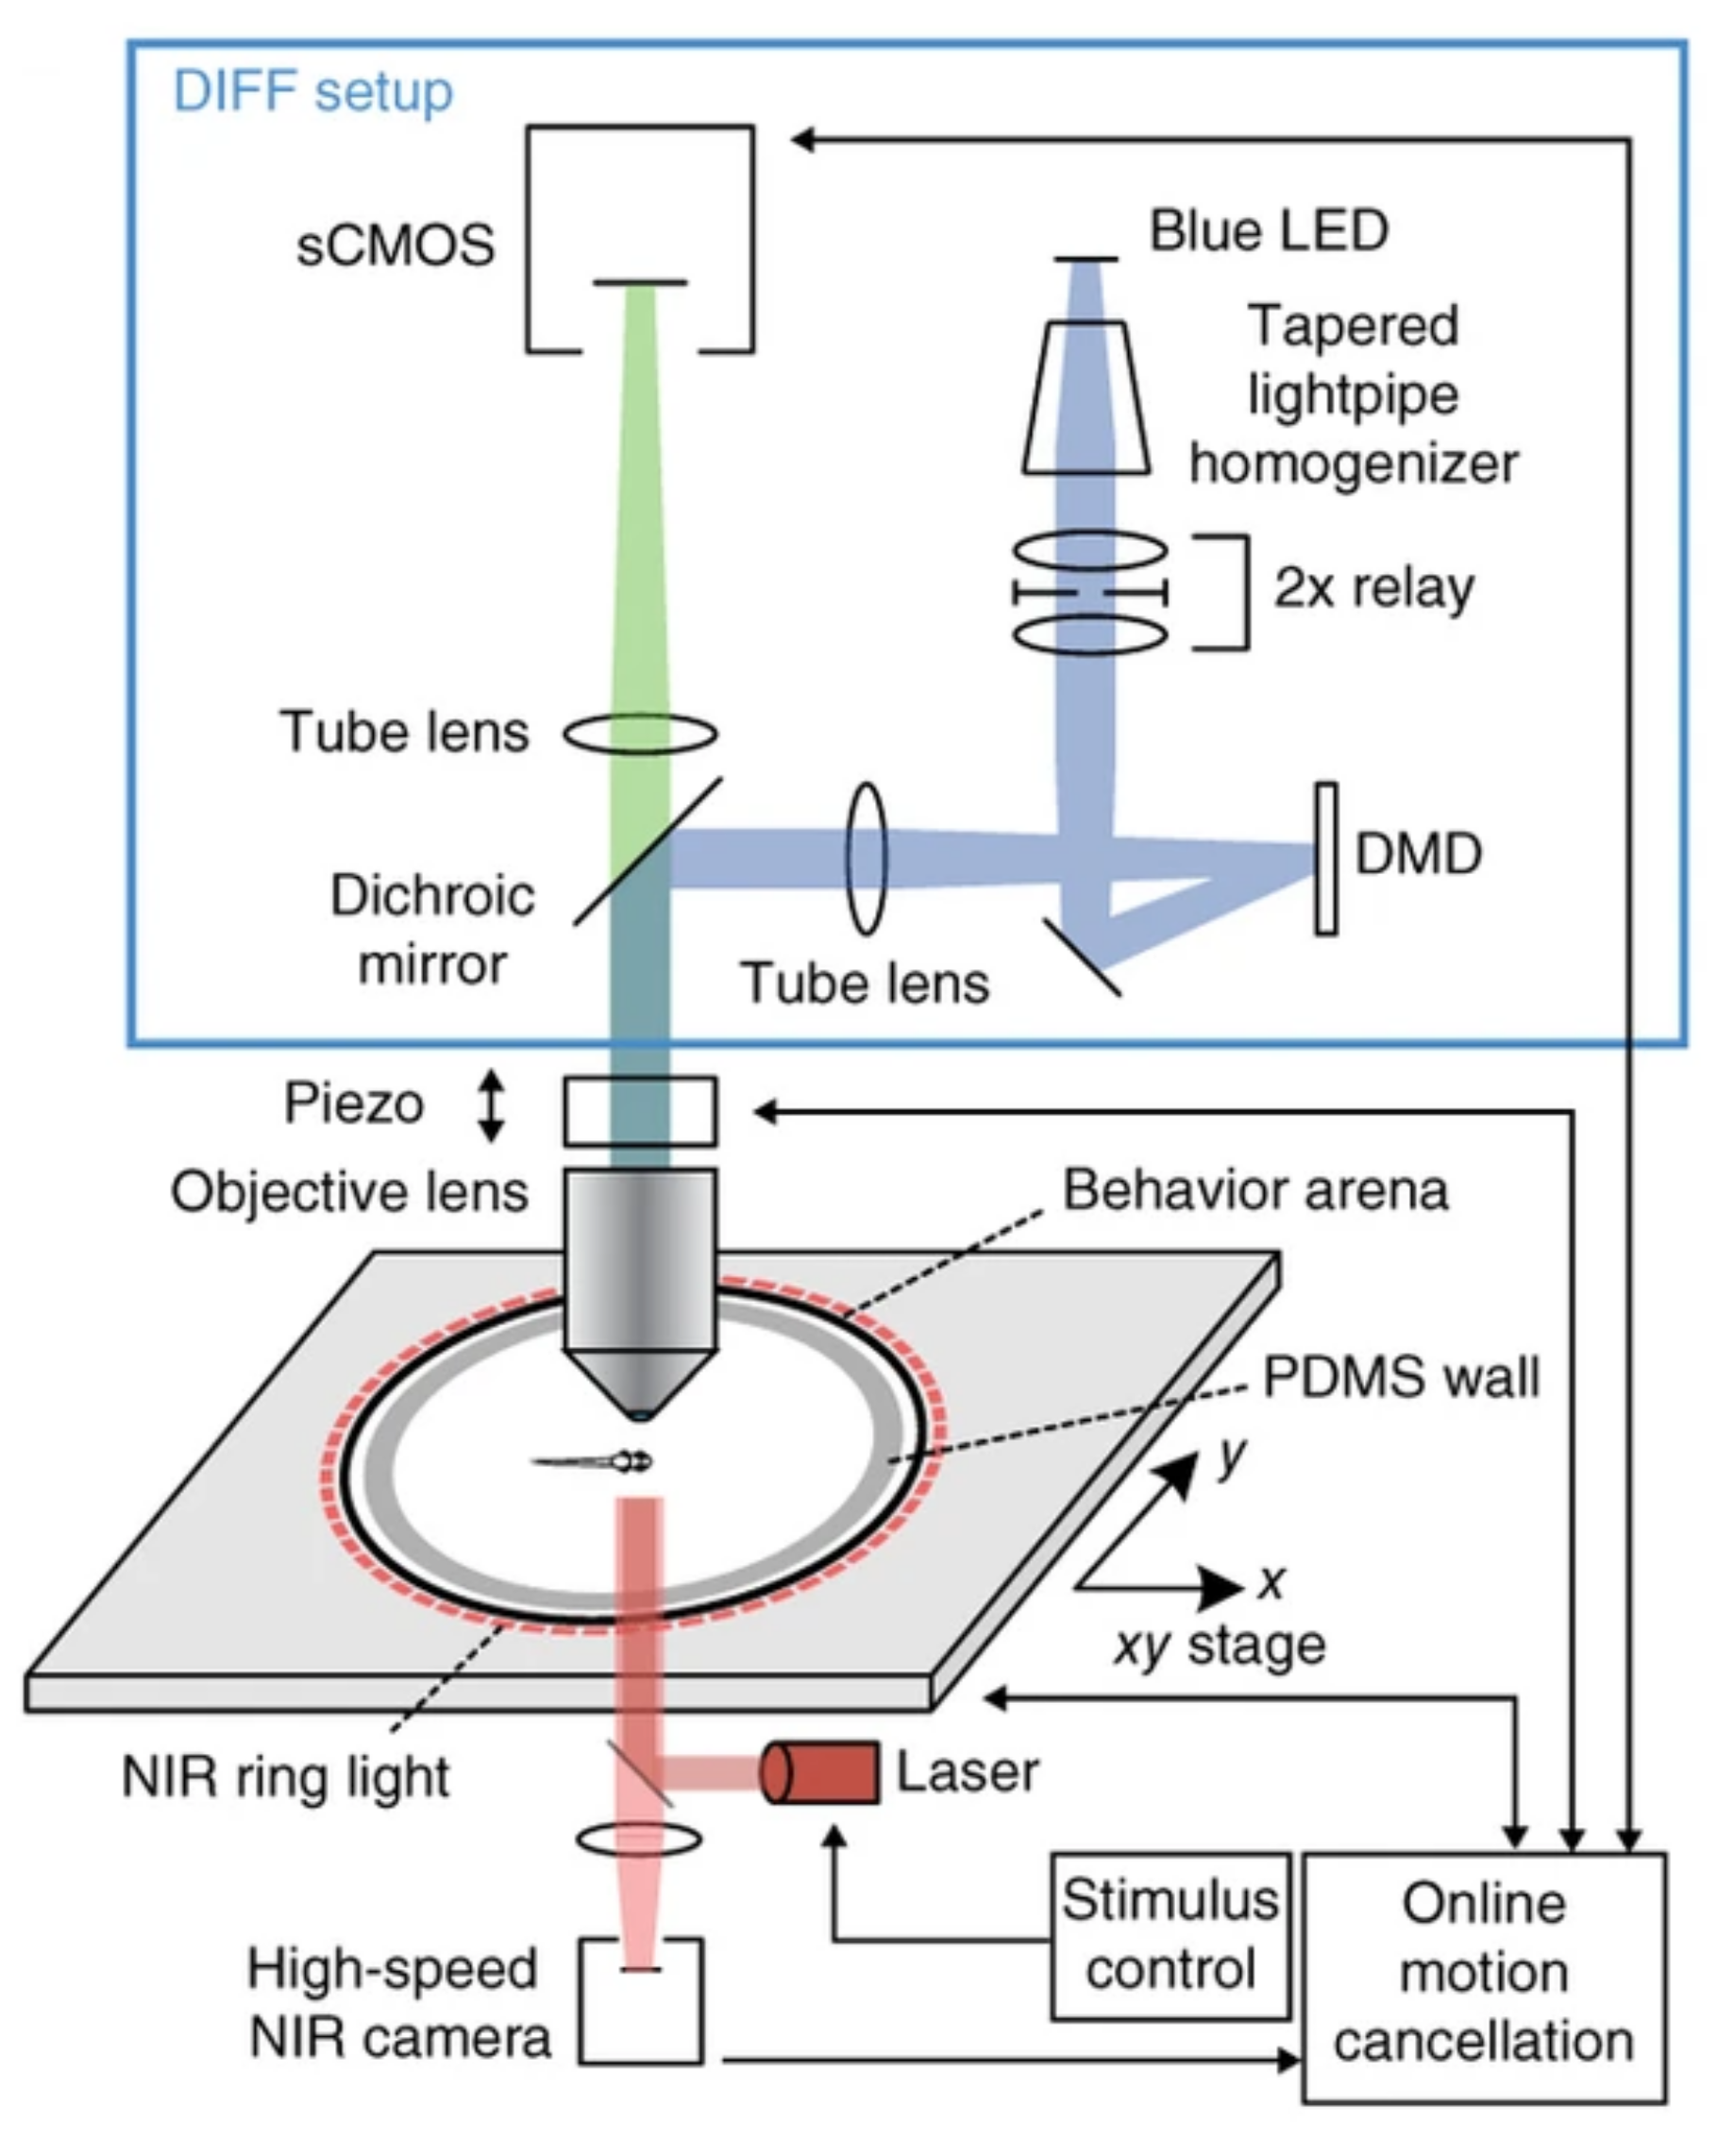
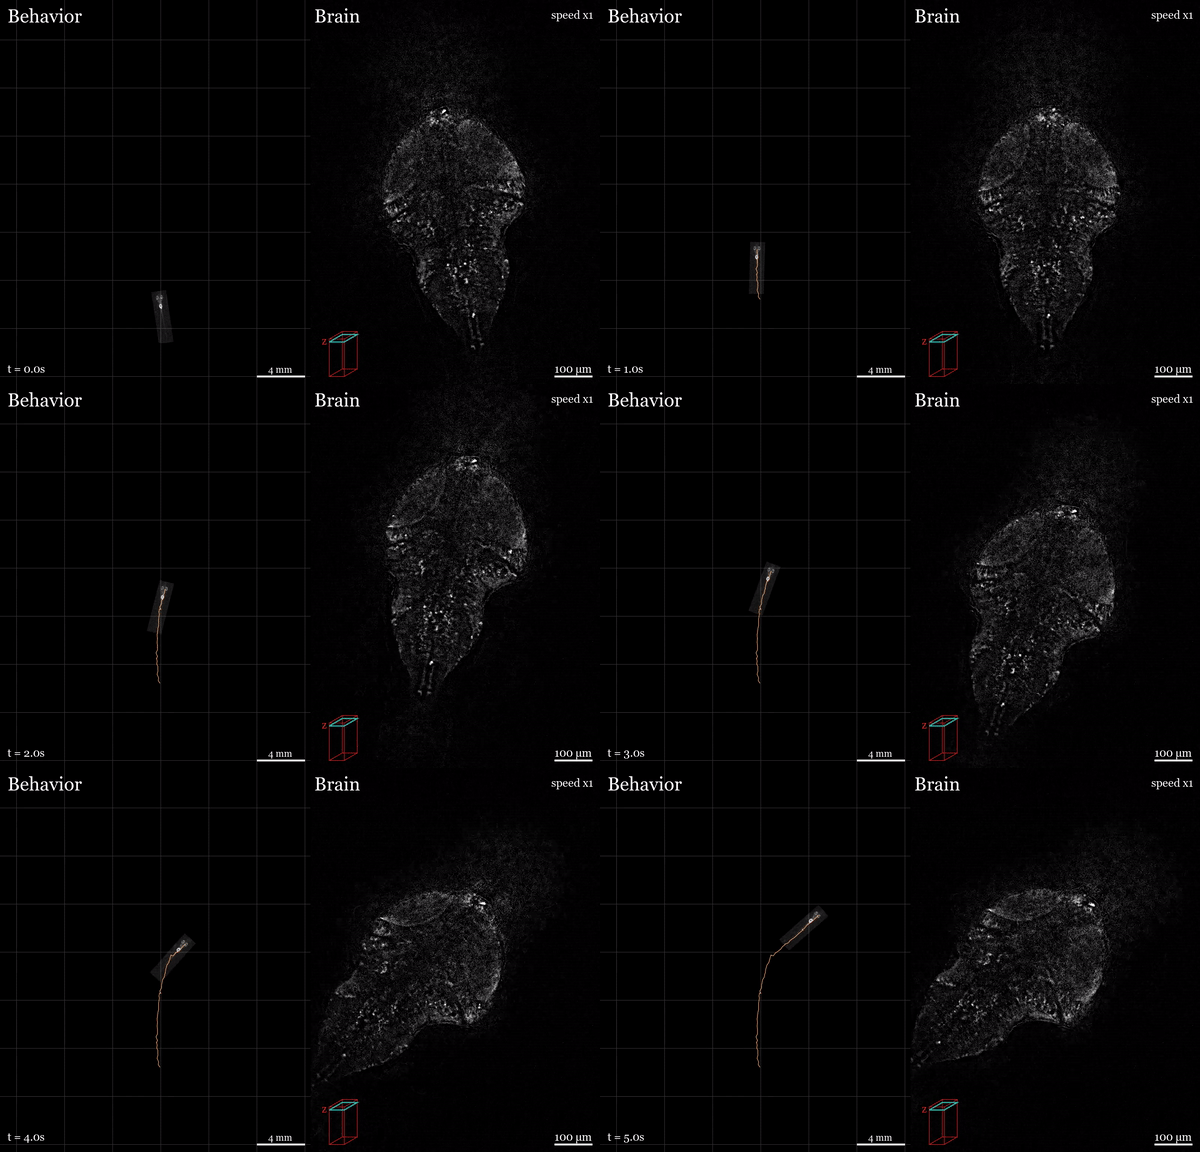
In this project, I used the setup shown above to study how the brain processes a simple visual stimulus during sleep vs. wake conditions. The visual stimulus I chose is referred to as a “dark flash” and corresponds to a 100-percent contrast “off” stimulus - That is, I simply turn off the white lights illuminating the fish’s behavioral arena so that the fish is briefly in the dark. In awake, alert fish, this stimulus is known to reliably ellicit high amplitude turning behavior, as shown in the time-lapsed image below.
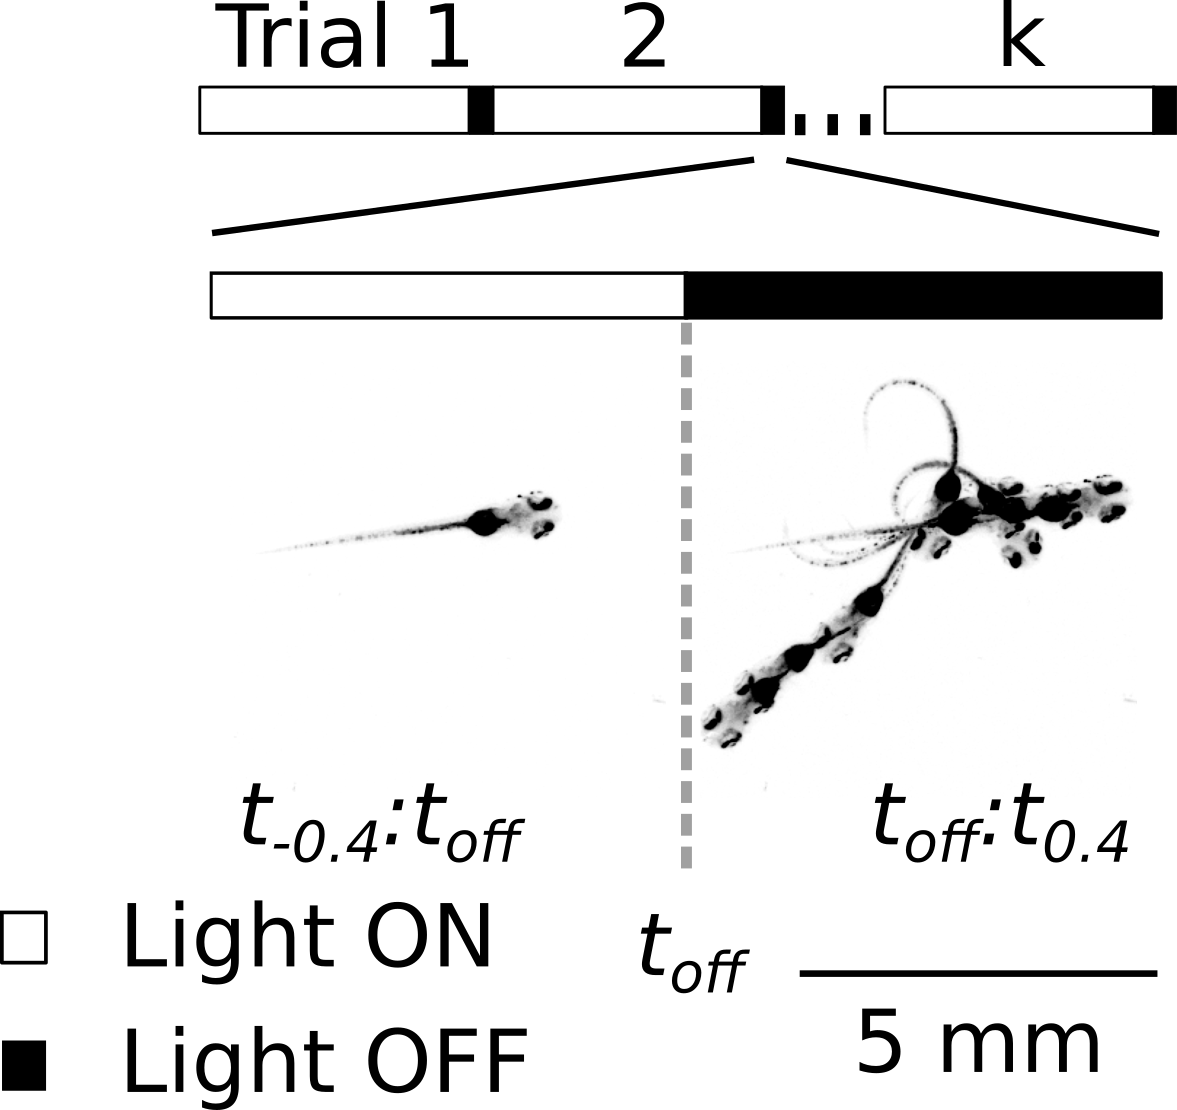
Interestingly, as part of a prior study which I co-led, we discovered that the same dark flash stimulus rarely ellicits a behavioral response when animals are in a quiescent, sleep-like state.

Motivated by these observations, we utilized our tracking microscope to image brain activity while presenting dark flash stimuli to freely behaving fish as they spontaneously transitioned between wake and sleep-like states. Each experiment lasted 1.5 hours and dark flash stimuli were presented once per minute to prevent significant adaptation to the stimulus. Animals that did not exhibit any sleep-like quiescence were excluded from our analysis.
The data
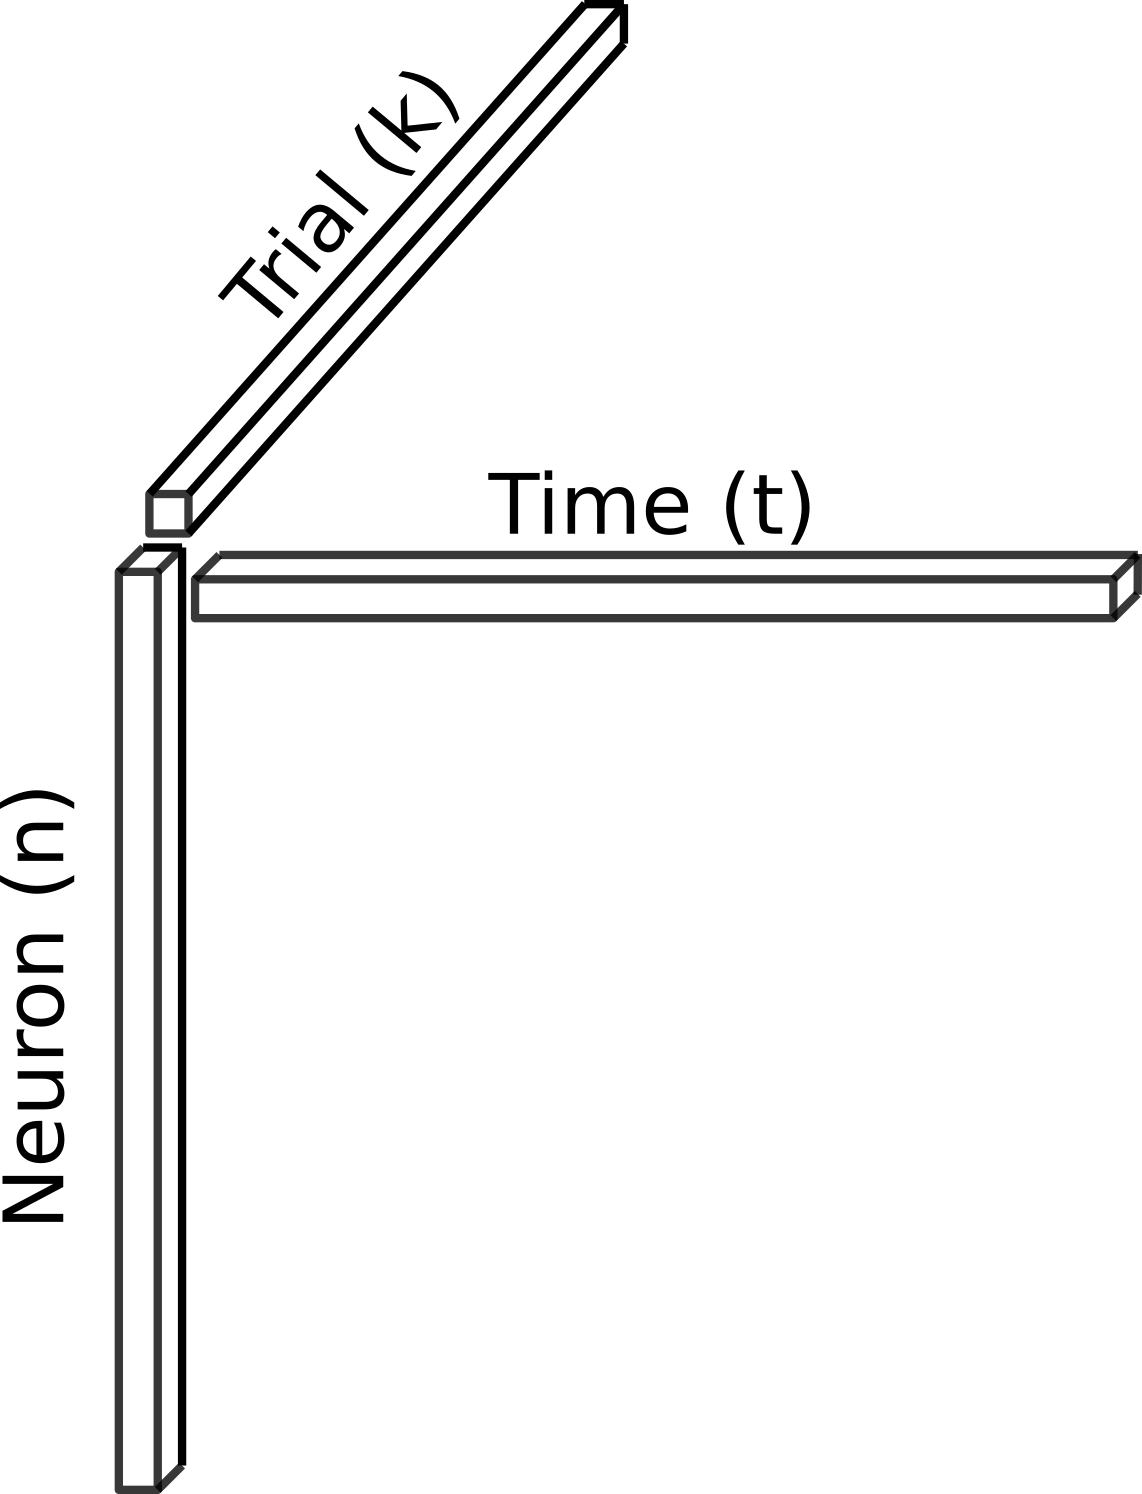
As described above, experiments lasted 90 minutes and a stimulus was presented once per minute, resulting in 90 “trials” per dataset. Thus, we structured the data as shown below for further analysis.
Behavioral data

Neural data
Results
Identify relevant neural populations
To study how the visuomotor computation driving the behavioral response to dark flashes changes as a function of internal state, it is necessary to first identify the neurons that compose this circuit. There are (at least) two critical components to this computation: Encode the visual stimulus and generate the motor output (high amplitude turn). To identify the neurons responsible for each, I used reverse correlation. To briefly elaborate on this technique, I will use the dark flash stimulus.
To identify visually responsive neurons, we “unwrap” our neural data tensor into a \(n\) x \(tk\) matrix and iterate over all \(n\) neurons to determine which of them contain information about the dark flash stimulus. The stimulus in the model is defined as a periodic impulse function – a vector of length \(tk\) which is zero everywhere except for at the stimulus onsets. The goal of model fitting is then to find each neuron’s “temporal impulse response filter.” Formally, we do this by fitting the Finite Impulse Response coefficients \(h\) in the model below, where \(\hat{r}_{i}(t)\) is the predicted activity of neuron \(i\) over all time. \(h\) are optimized to minimize the mean-squared-error between \(\hat{r}_{i}(t)\) and \(r_{i}(t)\), the true activity of the neuron. \(U\) are the number of time lags (FIR coefficients) to be fit. This approach allows us to remain agnostic to the particular temporal response profile that a neuron might have.
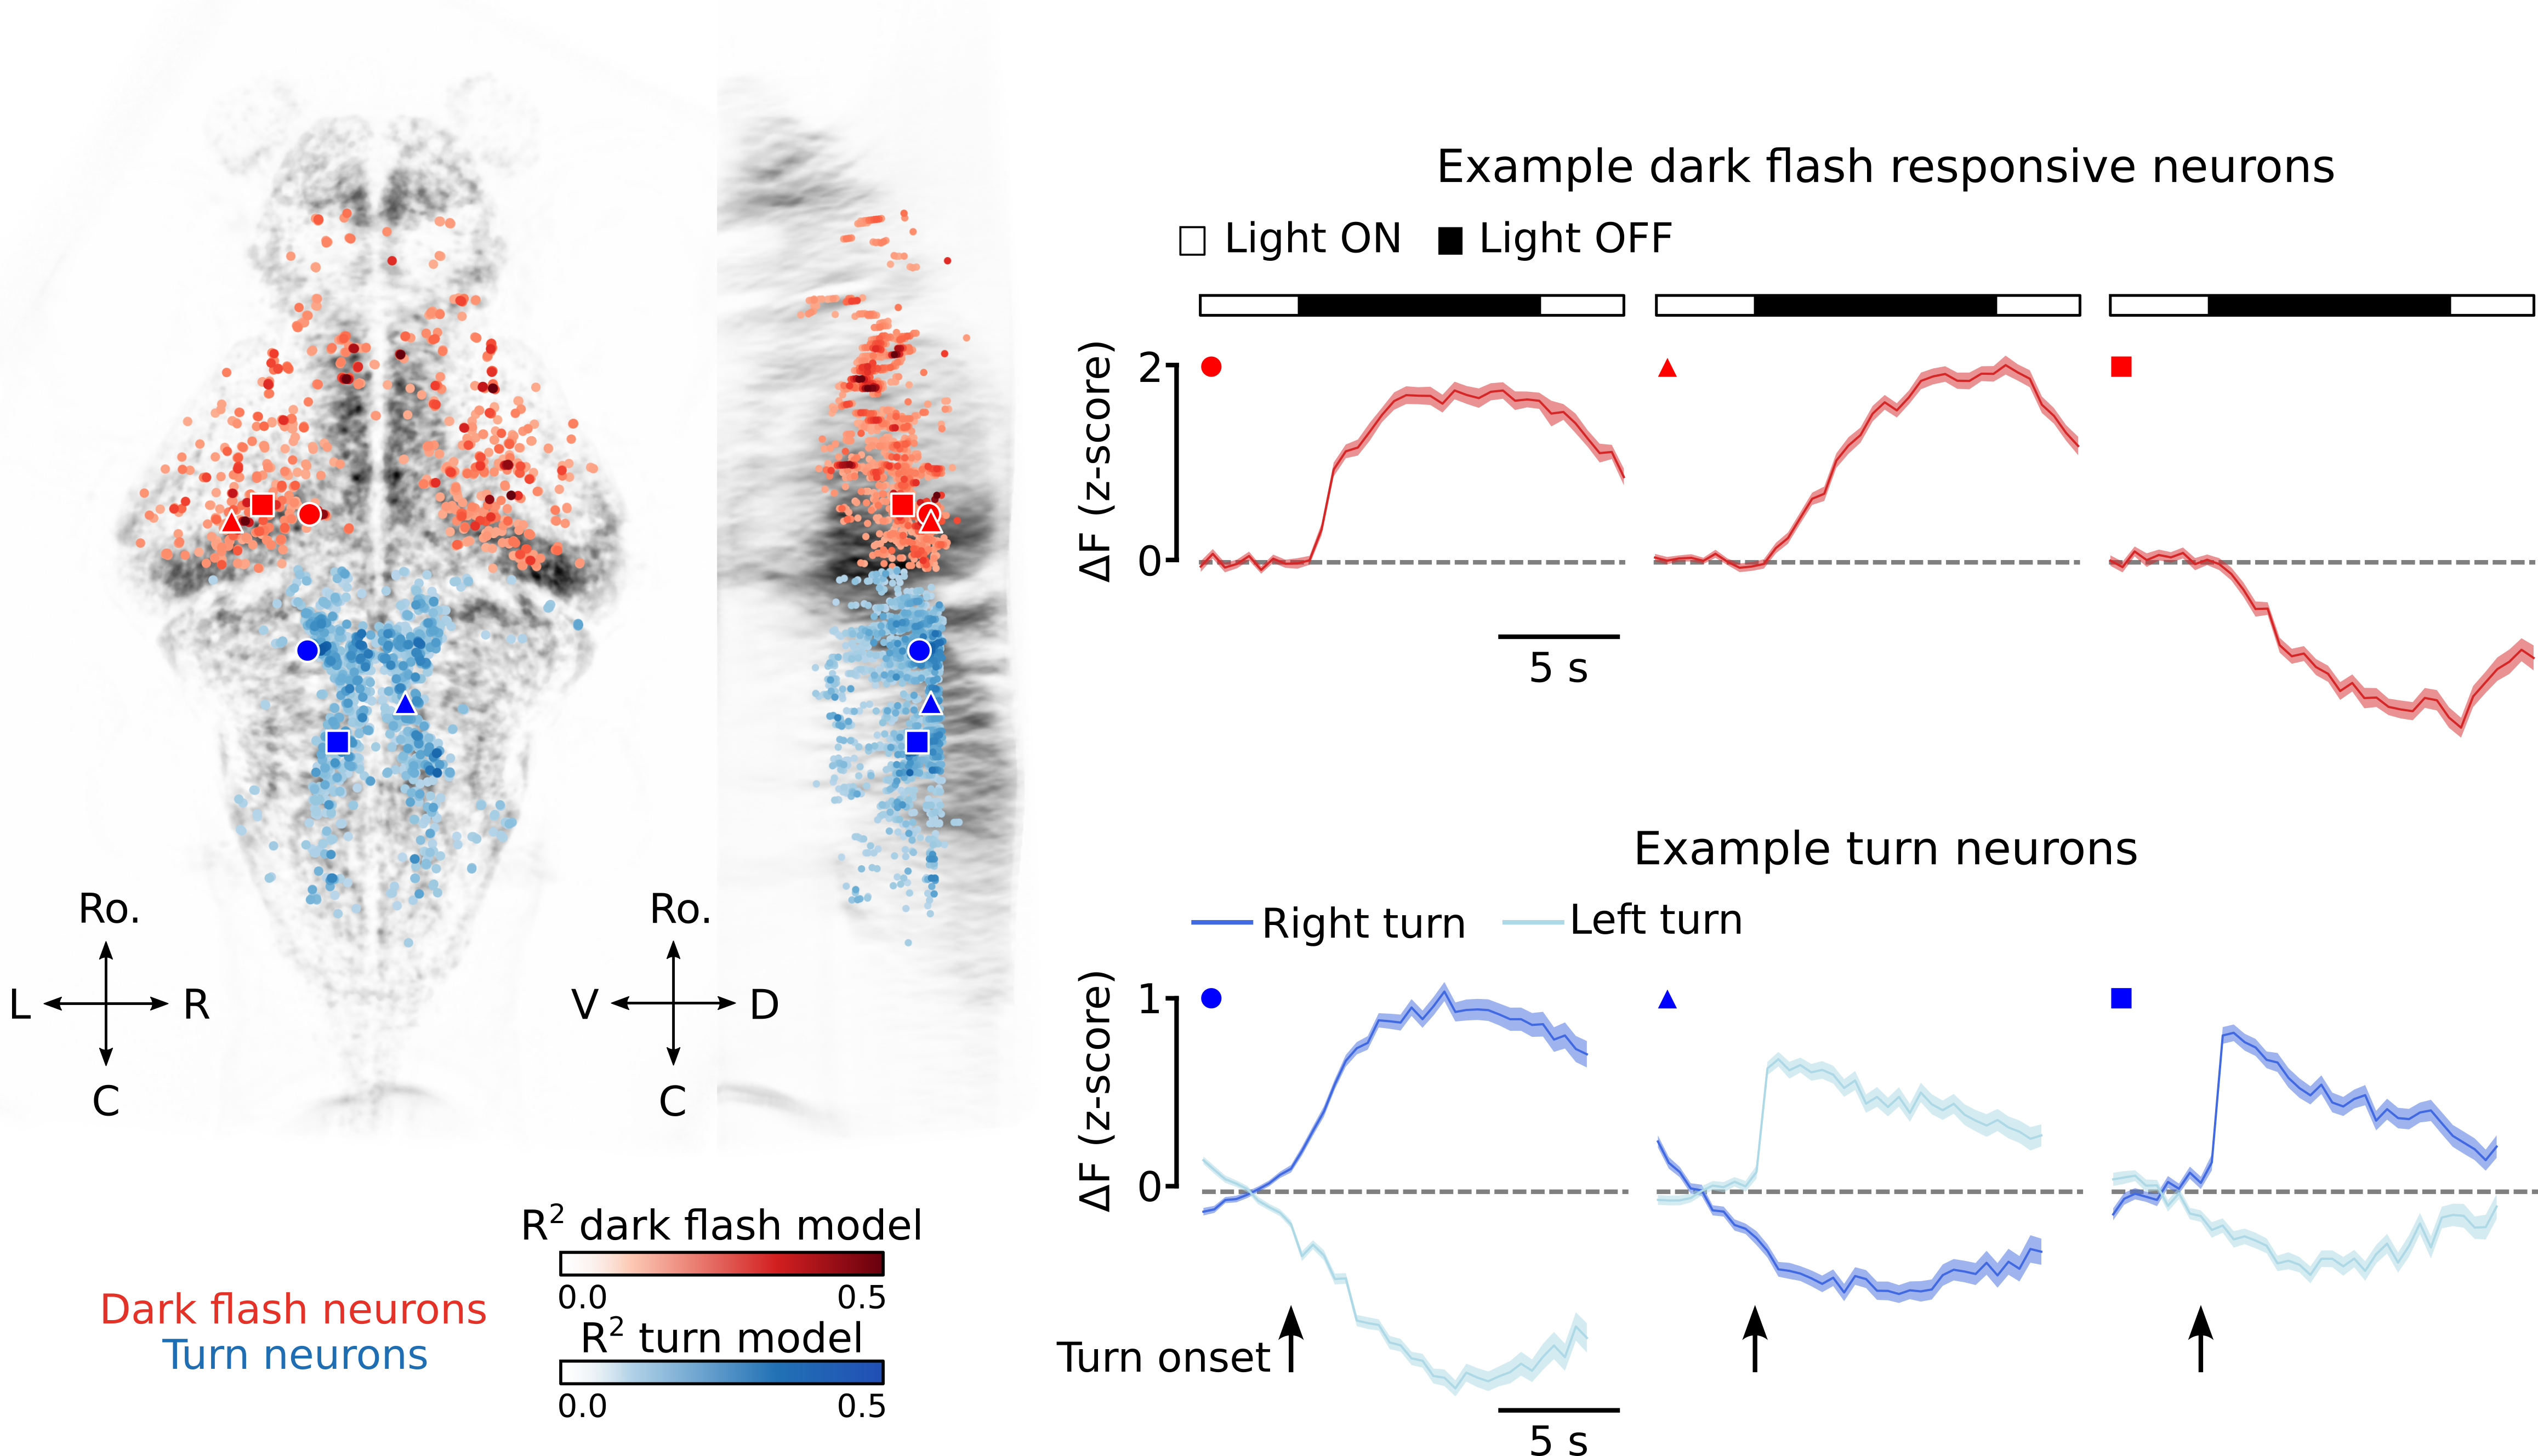
\[\hat{r}_{i}(t) = \sum_{u=0}^{U} h(t)s(t-u)\]To identify neurons that encode high amplitude turns, we followed a very similar approach. The only difference being that the stimulus, \(s(t)\), was turn onsets, not dark flash onsets. We compared cross-validated model performance (\(R^2\)) to that of a null model in which “stimulus” onsets were scrambled in time. Neuron’s with significant \(R^2\) values for either the visual or turn model were deemed as belonging to the visuomotor circuit. An example of these populations for one fish is shown below, along with the response profiles of 3 example visual neurons and 3 example turn neurons.
Leading hypotheses
Two exisitng hypotheses for “state-dependent” gating of behavior are:
- The gain hypothesis
- The null-space hypothesis
The gain hypothesis posits that downstream motor neurons simply sum the activity of upstream visual neurons. If their summed response crosses some threshold, then the motor neurons are activated and a behavioral response is generated. Under this framework, decreasing the response magnitude of visual neurons to the visual stimulus during sleep could explain the state-dependent behavior we have observed.
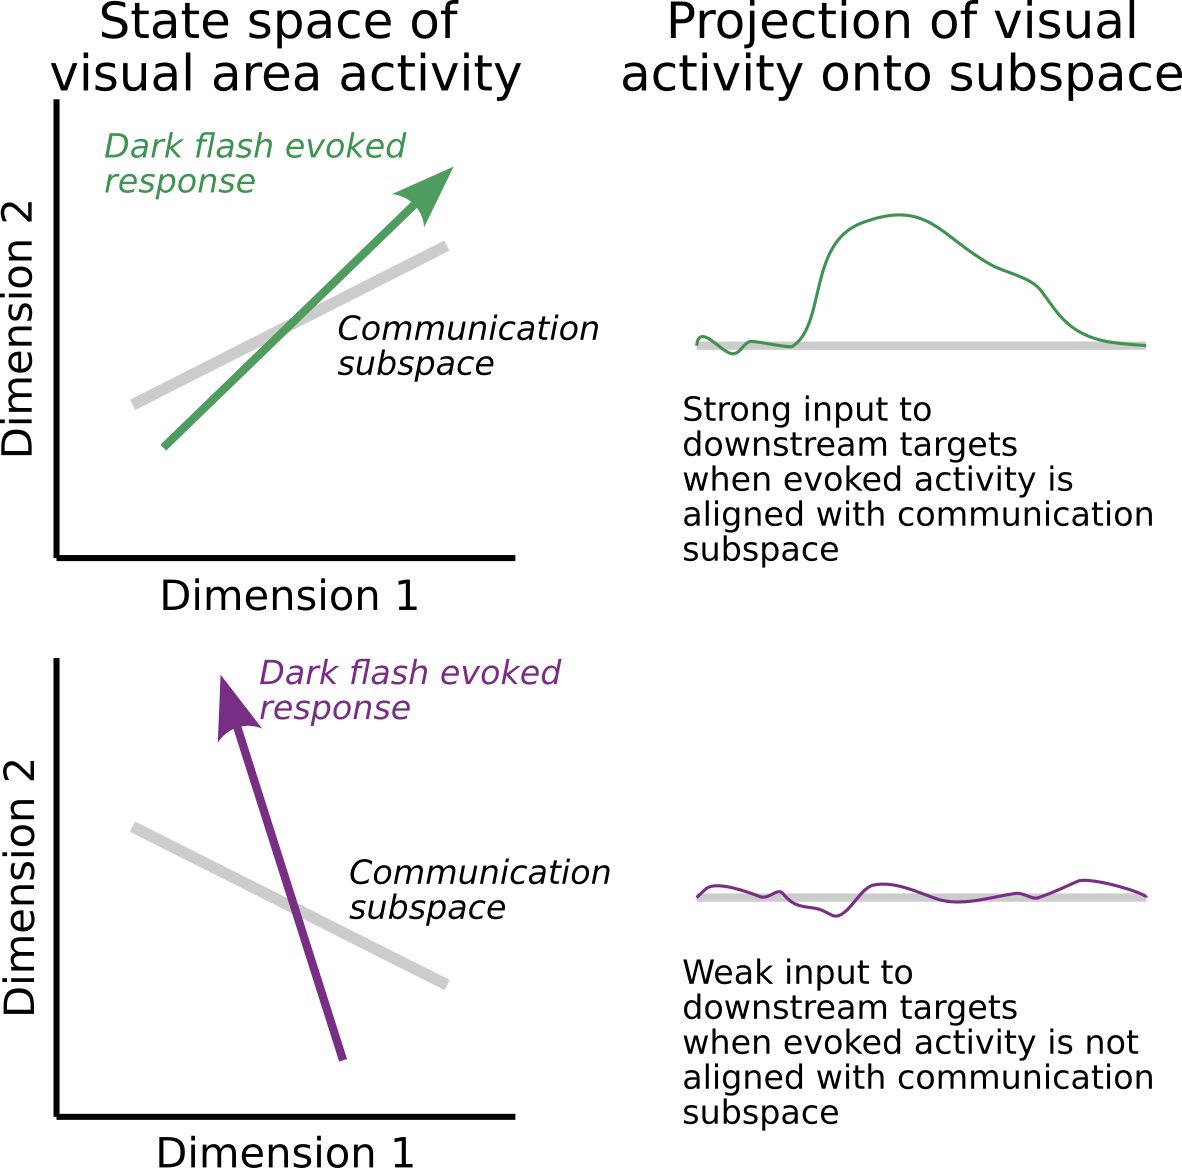
Alternatively, the null-space hypothesis proposes that there exist a very specific set of weights relating visual neuron activity to motor neuron activity and that these weights define a low-dimensional communication subspace linking visual neuron activity to motor neuron activity. Under this hypothesis, the idea is that sleep gates behavior either by causing a rotation of the visually evoked response or by causing a change in the communication weights such that visually evoked response the lies in the null-space of the motor neuron readout. This idea is illustrated below.
Gain hypothesis is not consistent with behavior
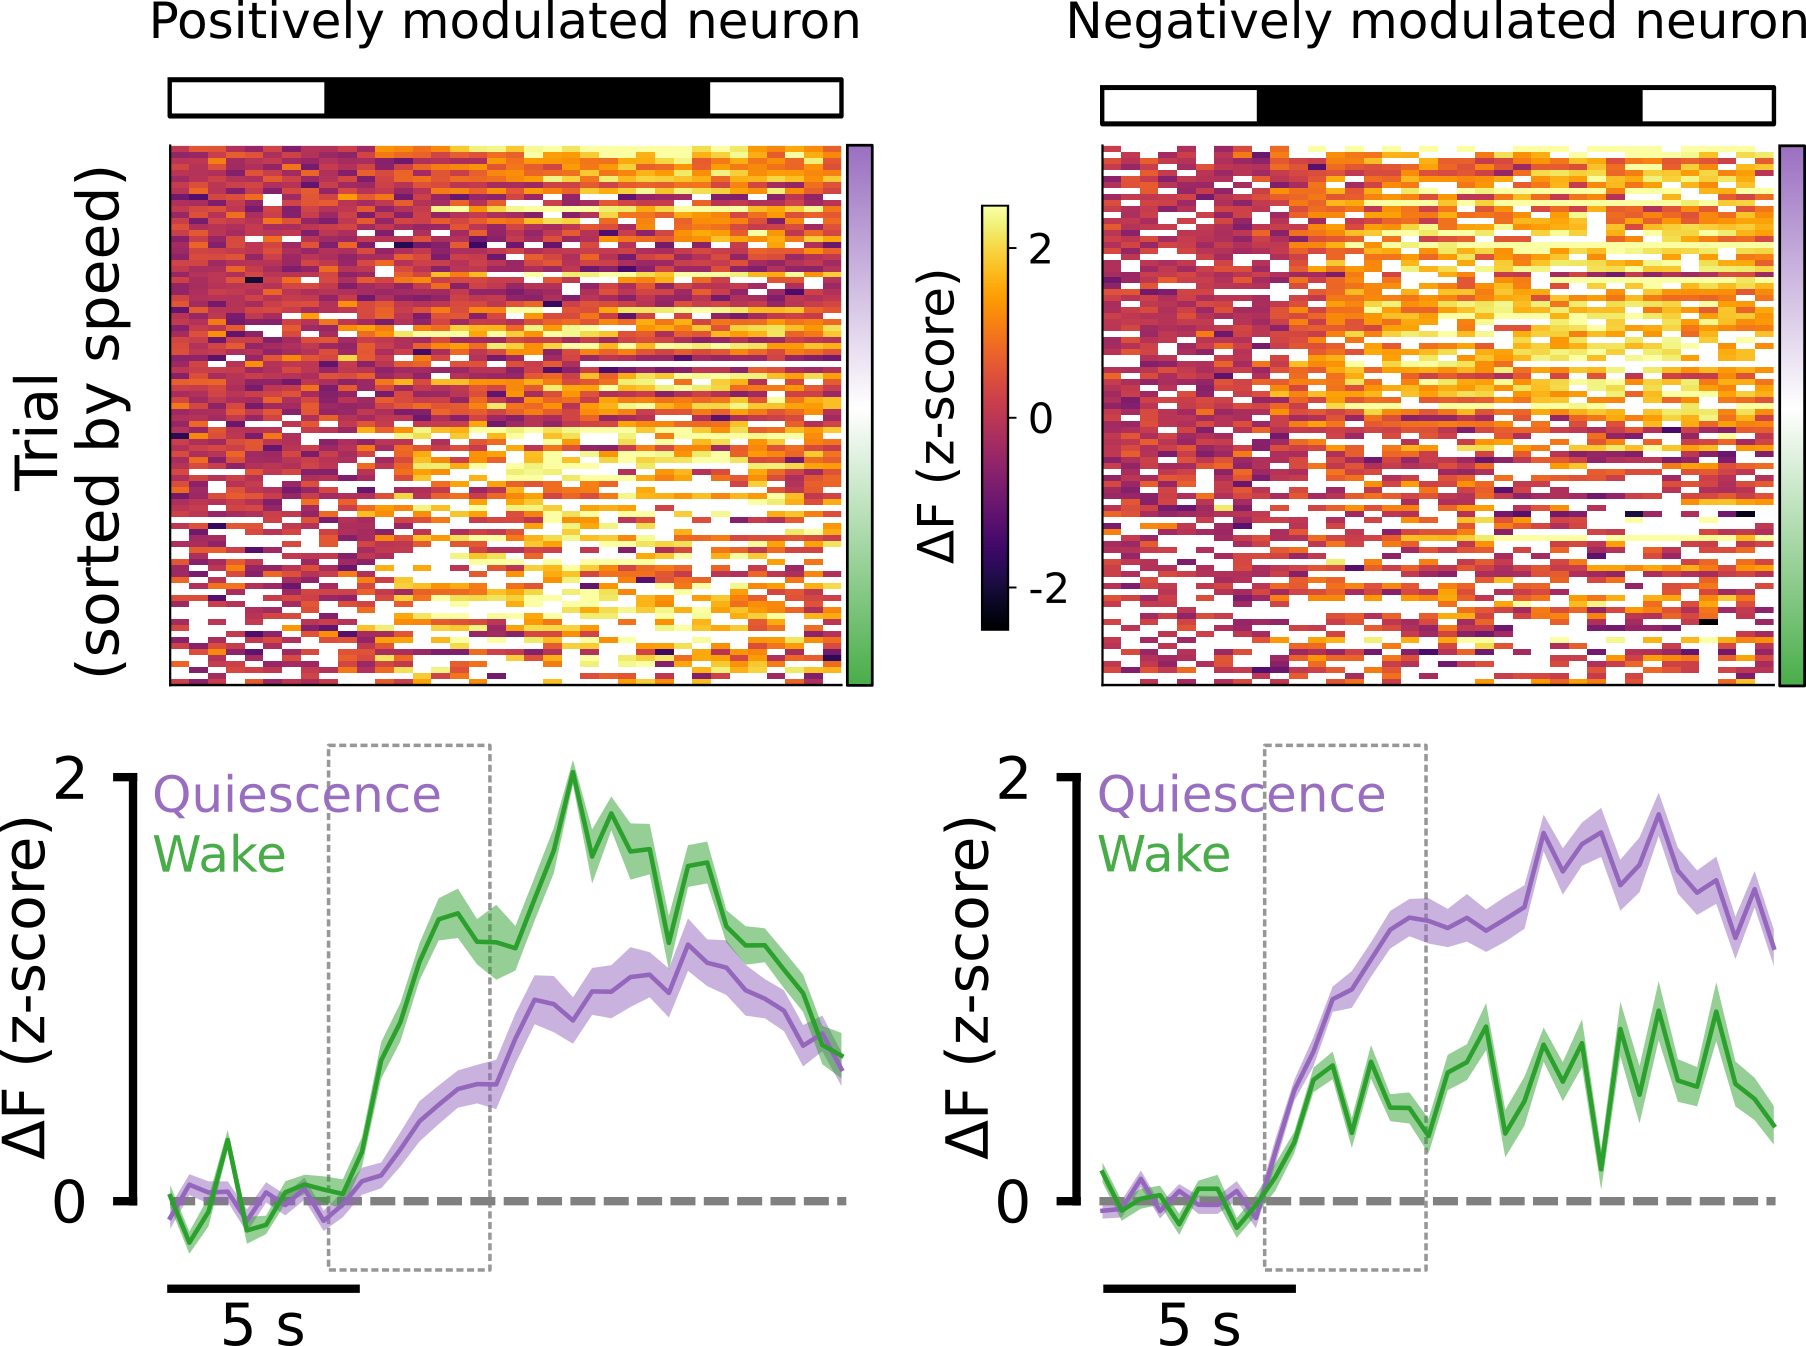
To test the gain hypothesis, we split the data up into wake and quiescent trials on the basis of the animal’s speed, as described above. We then computed the mean dark flash response of each visual neuron under each condition. Below are two example neurons: One that is positively modulated by the wake state (left) and one that is negatively modulated by the wake state (right).
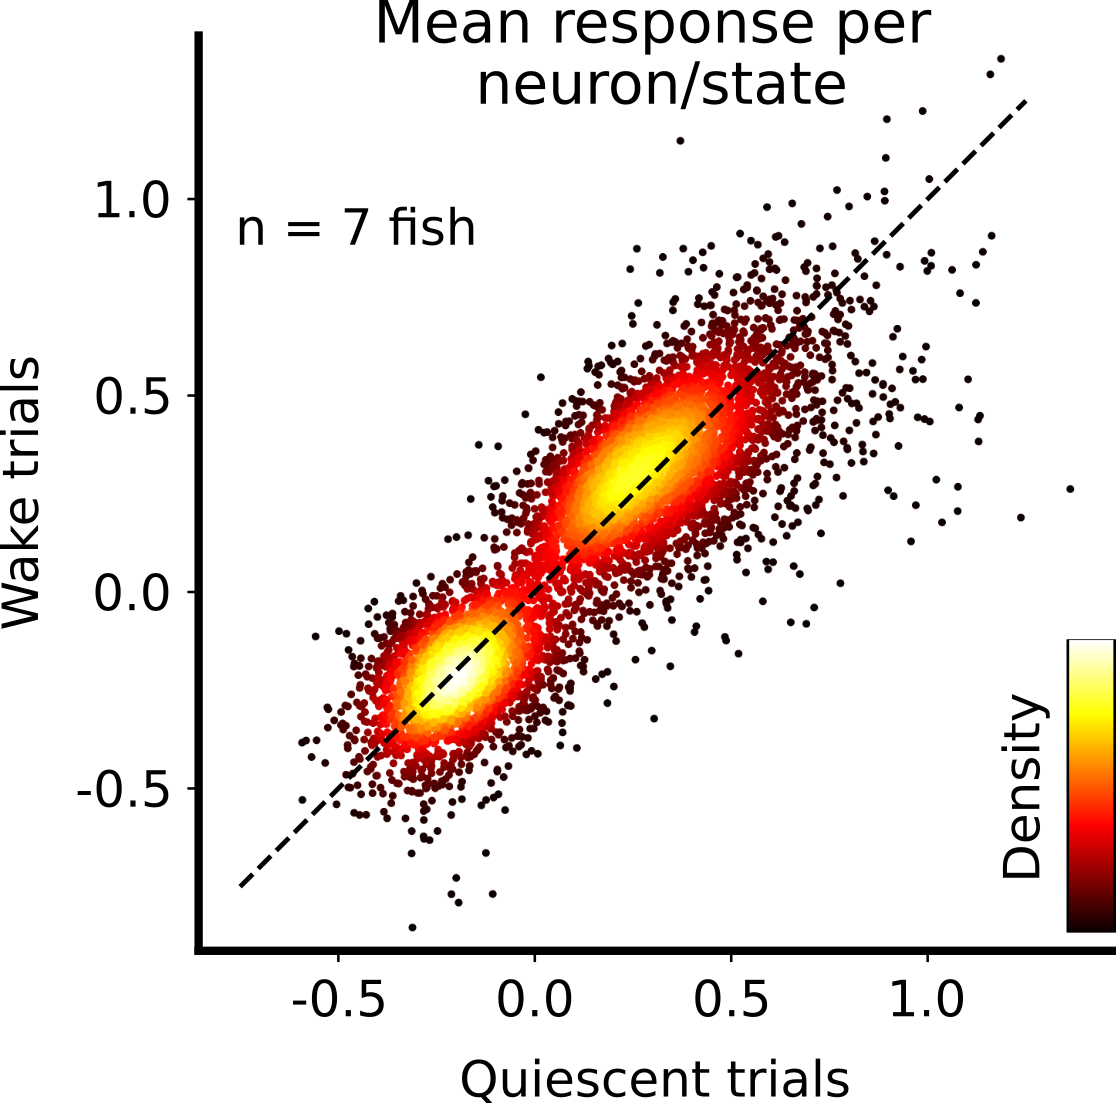
Across the population of visual neurons in all fish, we saw no clear trend for neurons to be postively or negatively modulated. Thus, we concluded that the gain hypothesis is unlikely to explain the state-dependent gating of fish behavior.
Null-space hypothesis is consistent with behavior
For testing the null-space hypothesis, we used Reduced Rank Regression (RRR) to identify the communication subspace linking visual neurons to motor neurons for each fish during each state (wake vs. quiescence). RRR identifies the dimensions of the source activity (the \(N_{visual}\) x \(k\) matrix of visual neurons) that are most predictive of the target activity (the \(N_{turn}\) x \(k\) matrix of motor neurons), subject to the constraint that the number of dimensions, \(m << min(N_{visual}, N_{turn})\). This is sketched out graphically below.
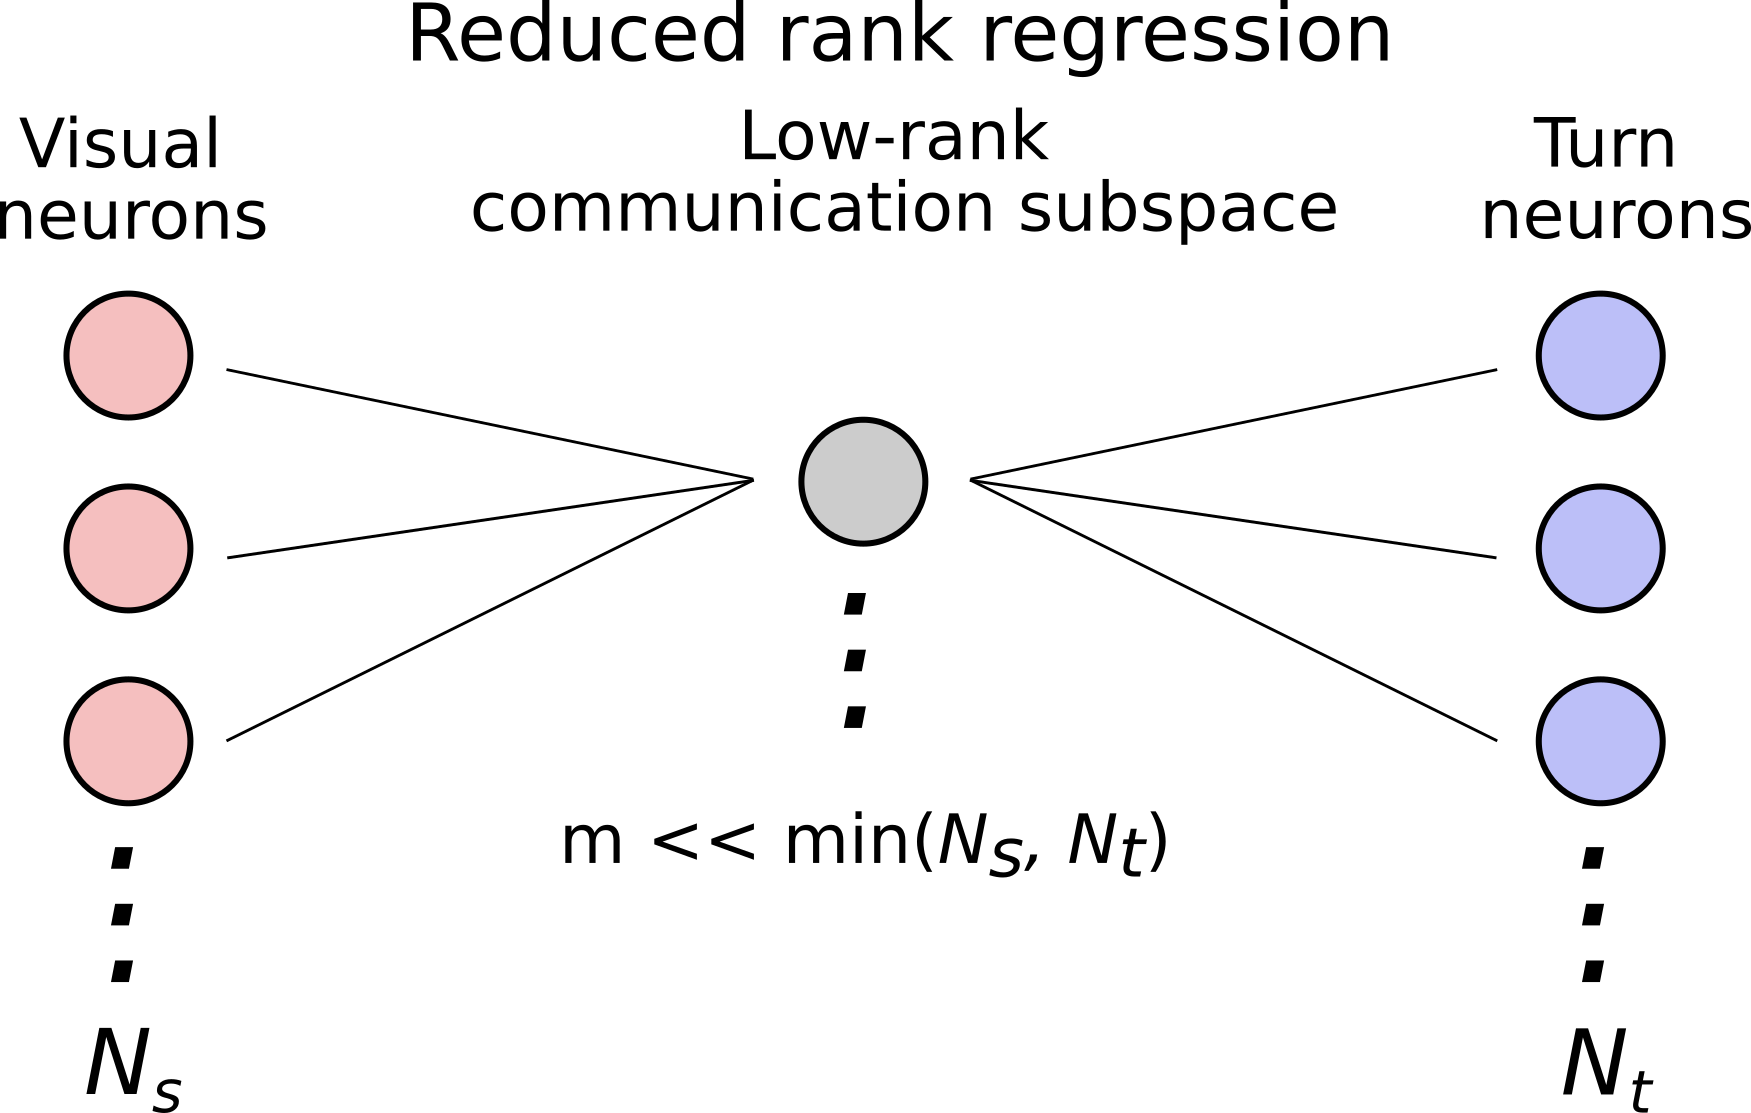
After fitting the RRR model, we selected the first dimension (\(m = 1\)) as our communication subspace and projected the dark flash evoked response of all visual neurons onto this subspace. Strikingly, we observed that the projected dark flash evoked activity during the quiescent state was almost zero, while during wake it was not. Thus, visually evoked response during sleep appears to lie in the null-space of the communication subspace. Said another way, the population of visual neurons seems to communicate information about the dark flash stimulus to motor neurons only during the wake state, consistent with the observed behavior.

Conclusions and future directions
The results shown here are preliminary, however, from our analysis and data thus far it seems that state-dependent sensorimotor gating could be achieved by dynamic modulation of the connectivity weights between visual and turn neuron populations which, in turn, causes the dark flash evoked response in visual neurons to have no impact on motor neurons during sleep.
We are currently conducting further experiments to determine if this finding holds up across many fish. In addition, we are working on adapting the current computational method (RRR) to explicitly model the dynamically changing connectivity weights. This would allow us to fit one model to the data of each fish, rather than fitting a separate model for wake vs. quiescence. By doing this, we hope to 1. achieve more robust model fitting, as we could then leverage the full dataset to optimize model parameters and 2. discover the underlying gating dynamics in an unsupervised way, rather than imposing the somewhat arbitray division of wake vs. quiescence onto the data. This would be a novel approach to latent variable discovery from functional neural data, currently a very popular topic of research in computational and systems neuroscience.